
| GRASS DRYNESS | FOREST DRYNESS | FIRE INTENSITY |
|---|---|---|
Wisconsin Fire Weather Operating Plan.pdf
| Date | Temp ºF | Humidity % | Wind Speed mph | Rainfall in | FFMC | DMC | DC | ISI | BUI | FWI | FWI DC |
|---|---|---|---|---|---|---|---|---|---|---|---|
| 3/23/2026 | 38.8 | 41 | 4.0 | 0.00 | 81.3 | 6 | 309 | 1.8 | 11 | 1.5 | LW |
| 3/22/2026 | 38.2 | 62 | 8.0 | 0.00 | 75.8 | 5 | 309 | 1.5 | 10 | 0.9 | LW |
| 3/21/2026 | 54.1 | 61 | 1.0 | 0.00 | 69.1 | 5 | 308 | 0.7 | 9 | 0.4 | LW |
| 3/20/2026 | 57.0 | 59 | 0.0 | 0.04 | 57.0 | 4 | 306 | 0.3 | 7 | 0.2 | LW |
| 3/19/2026 | 42.8 | 69 | 9.0 | 0.21 | 48.1 | 3 | 304 | 0.3 | 5 | 0.1 | LW |
| 3/18/2026 | 30.3 | 87 | 0.0 | 0.03 | 72.8 | 5 | 317 | 0.7 | 10 | 0.4 | LW |
| 3/17/2026 | 18.4 | 76 | 1.0 | 0.00 | 77.8 | 5 | 317 | 1.0 | 10 | 0.6 | LW |
| 3/16/2026 | 19.2 | 88 | 16.0 | 0.00 | 77.5 | 5 | 317 | 3.3 | 10 | 3.5 | MD |
| Index | Low | Moderate | High | Very High | Extreme |
|---|---|---|---|---|---|
| FFMC | 0-81 | 81-88 | 88-90.5 | 90.5-92.5 | 92.5+ |
| DMC | 0-13 | 13-28 | 28-42 | 42-63 | 63+ |
| DC | 0-80 | 80-210 | 210-274 | 274-360 | 360+ |
| ISI | 0-4 | 4-8 | 8-11 | 11-19 | 19+ |
| BUI | 0-19 | 19-34 | 34-54 | 54-77 | 77+ |
| FWI | 0-5 | 5-14 | 14-21 | 21-33 | 33+ |
| CBI | 0-50 | 50-75 | 75-90 | 90-97.5 | 97.5+ |
-
Interpretation
- The above chart is a generalized fire danger rating chart for the Canadian Fire Weather Index from Minnesota DNR. It is based on a five class danger rating system, i.e., low, moderate, high, very high , and extreme. Low days occurred 45% to 50% of the time, moderate - 30 %, high days - 12% to 15%, very high days occurred 7%-8% of the time, and extreme days were 2%-3%. For instance, if you have a drought code of 380, it does not mean you are in extreme fire danger. It means that the drought code only gets that high on 2% of the days between April 1 and November 1.
-
Definitions
- Fine Fuel Moisture Code (FFMC) This provides a relative indicator of the moisture in the fine fuels. Like the 1 hour fuel moisture, it reacts directly with the air temperature and relative humidity. Used to indicate the ease of ignition of ignition probability.
- Duff Moisture Code (DMC)This is an index of the moisture of the loosely compact organic layers at a depth of 2-4 inches. Can be used to assist in predicting the probability of lighting fires.
- Drought Code (DC) This measures long term dryness in the fuels. It is a longer term index than the NFDRS 1000 fuel moisture. It doesn't reflect the probability of fire occurrence by itself, but can be useful in predicting the level of mop up needed and the consumption of large fuels. It should be looked at in relation to peat fire starts. Useful as an estimator of mop-up difficulty due to deep burning fires.
- Initial Spread Index (ISI) This is based on the FFMC and the wind speed. It provides a relative numerical rating of the expected rate of spread. This is similar to the NFDRS Spread Component.
- Buildup Index (BUI) This index is based on the DC and the DMC. It provides a relative indication of the amount of fuel available for combustion. This is somewhat similar to the NFDRS Energy Release Component. It doesn't predict what a given day might be like, but does relate well to the dryness of the fuels.
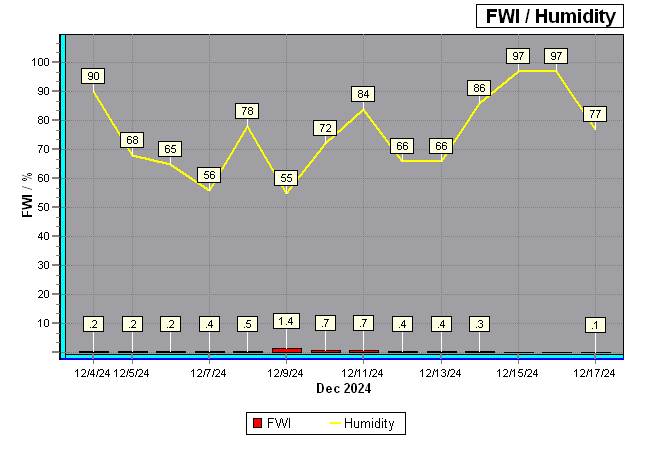
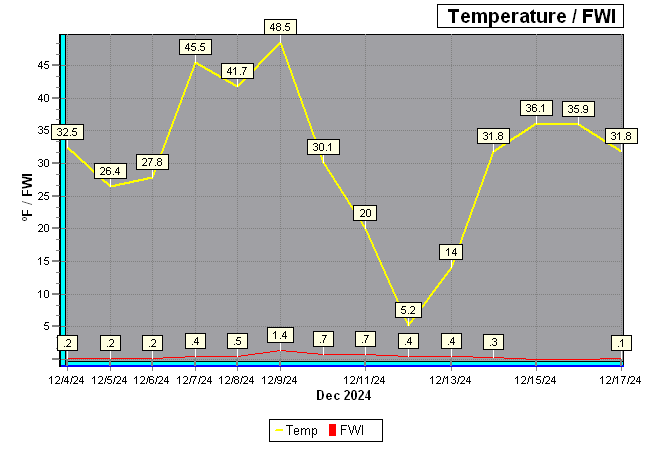
- Fire Weather Index (FWI) This combines the BUI and the ISI to give a relative numerical rating of fire intensity. It can be compared to the NFDRS Burning Index. Indicator of relative fire intensity or general fire behavior characteristics (e.g. surface fire, torching, crowning).
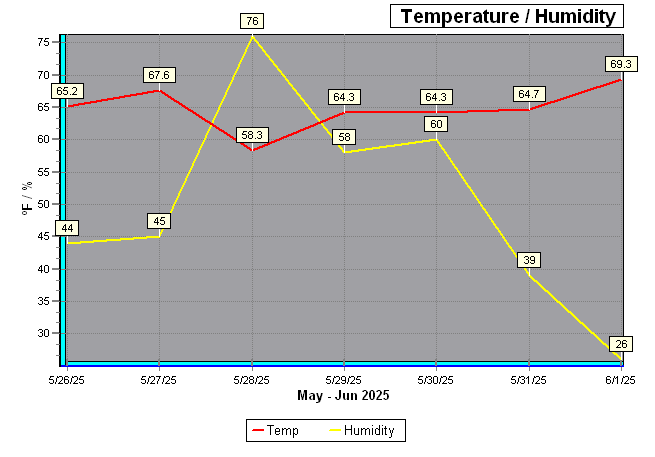
- Chandler Burning Index (CBI) The Chandler Burning Index (CBI) uses the air temperature and relative humidity to calculate a numerical index of fire danger. That number is then equated to the Fire Danger severity of either low, moderate, high, very high and extreme. It's based solely on weather conditions, with no adjustment for fuel moisture.
FWI data compliments of FWI Calc.